

|
|
|
ESMS provides extensive graphical display capabilities where drawing objects defined within diagrams may be animated and where their appearance changes are driven by data obtained from other ESMS Applications and databases.
This capability is based upon diagrams developed in Microsoft Office Visio Pro 2007. Objects defined within Visio may display state information about system objects in a graphical format. The system objects presented in a diagram and the nature of their animation are dependent on the business process to be presented.
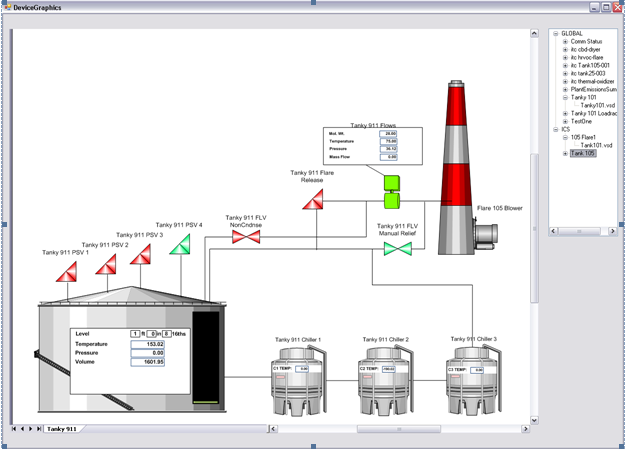
The window below displays a complex SCADA operation for emissions monitoring. In it, a Visio diagram is animated by ICS's State Graphics application. Within this diagram Visio objects are continuously updated. Right-clicking on any object provides access to the command interface for detailed state information, related system elements, and control over the deices just as for portals. When an operator clicks on an event in the SCOREBOARD for which there is an associated state graphic, that graphic will appear in a scoreboard linked graphics display.
Multiple additional displays are also supported. Operators may change displayed graphics merely by navigating the tree structure at right and move from one display to another by clicking in the desired display. Default views that are associated with the point with which the graphic component is associated will be displayed automatically, to include multiple views as is illustrated later.