|
|
|
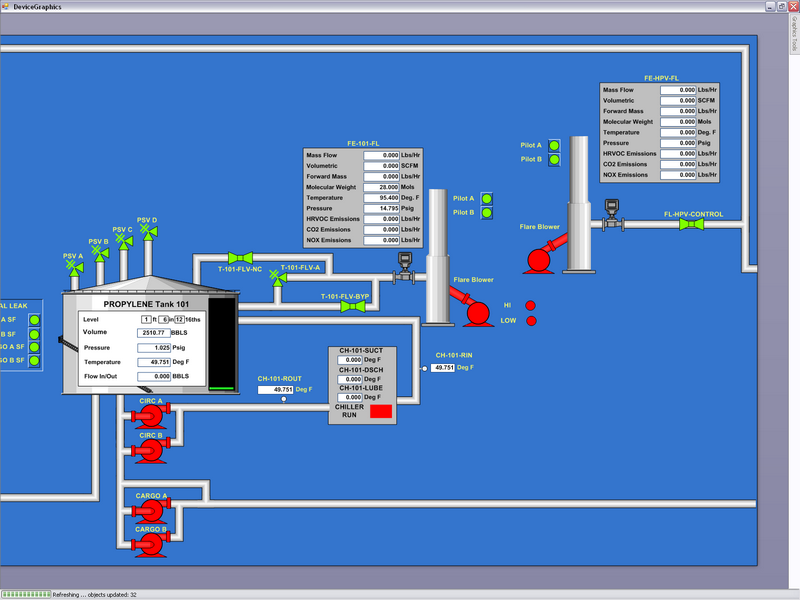
In the figure below is a simple ESMS Graphic representing the state of a storage tank and flare assembly typically found in a petrochemical terminal operation. It is an example of a SCADA (Supervisory Control and Data Acquisition) system and presents the states of the large number of system components that make up such a system. Animation of these graphics enables system operators to quickly visualize the operation of their system.
The applicability of animation of diagram objects in graphics is not limited to SCADA applications. Any Visio diagram representing anything may be animated. An access control site plan, a network diagram, some bar charts representing counts, and any other collection of data values may be presented within ESMS Graphics.
Animated graphics are created because they serve a purpose. Such graphics allow system administrators to create living pictures that represent the state of a system as reflected by the data values stored in ESMS. These data values are associated with objects in the graphic giving context and understanding to the state of the system.
As an example of a business process, consider the typical industrial assembly of a storage tank, an associated flare, and other safety devices. Storage tanks hold compounds and the example here identifies a tank - Tank 101 - as holding PROPLYENE. Pumps fill and empty the tank and a series of pressure safety valves protect the tank should it become over pressurized. A safety valve is designed so that it opens if pressure reaches a pre-established value.
Since such products are both flammable and toxic, their release is a serious event. The pressure safety valve (FLV A) will open at a specified pressure and flow product to the flare, which will destroy the escaping product by burning it. The pressure for this flare's opening is lower than the pressure safety valve pressure settings that allow the release of product to the atmosphere (PSV A, PSV B, PSV C, PSV D). This burning is not 100% efficient and produces several other compounds that must be tracked.
Typically, the contents of such a tank must be refrigerated to keep pressures down and a chiller, whose input and output temperatures must be tracked, is shown in the diagram. Sometimes, plant operators may want to release product by opening a manual control valve (MCV A or FLV 101) to the flare to avoid the possibility of an atmospheric release.
As one can see, a large number of data values must be presented in the graphic to understand the health of this system and these values change by the second. Moreover, some of these values are used to calculate important parameters that must be reported, controlled, and understood, and these values also change second-by-second.